The Lineup
I had a great time on Thursday during the morning Deep Dive session. Our Analytics track was doing a Visualization Showcase. Mike Jelen was our MC. We had on the panel Andy Tauro, Teal Sexton, Tim Vlamis, Myself, Neviana Zhgaba, and Gary Adashek.
DataViz showcase at #Kscope19 @odtug @GADASHEK @NevianaZhgaba @TealSexton @Bec_Wagner @TimVlamis pic.twitter.com/XRSxLvaDrO
— Kevin McGinley (@kevin_mcginley) June 27, 2019
Andy digs into flavor
I learned a lot during Andy’s session about DV and Explain, as well as flavor profiles. He was a great sport about going adhoc to demo the Explain feature at Mike Durran’s direction and guidance.
Teal does D3 beautifully
Teal showed what can be done with a good plan, and great visuals. The Berkeley page is fantastically interactive and answers business questions in a very visually appealing way.
Tim teaches timely differentiation
Tim is a natural teacher. In 10 minutes he was able to show the best and quickest way to take normal data and make the most meaningful visual representations from it. I actually had a data set from our vendor booth that I used and followed along Tim’s steps in real time.
Alliterating Becky always audits
I first showed the data set I just used from Tim’s talk to the crowd. Thank you Tim for the great instructions.
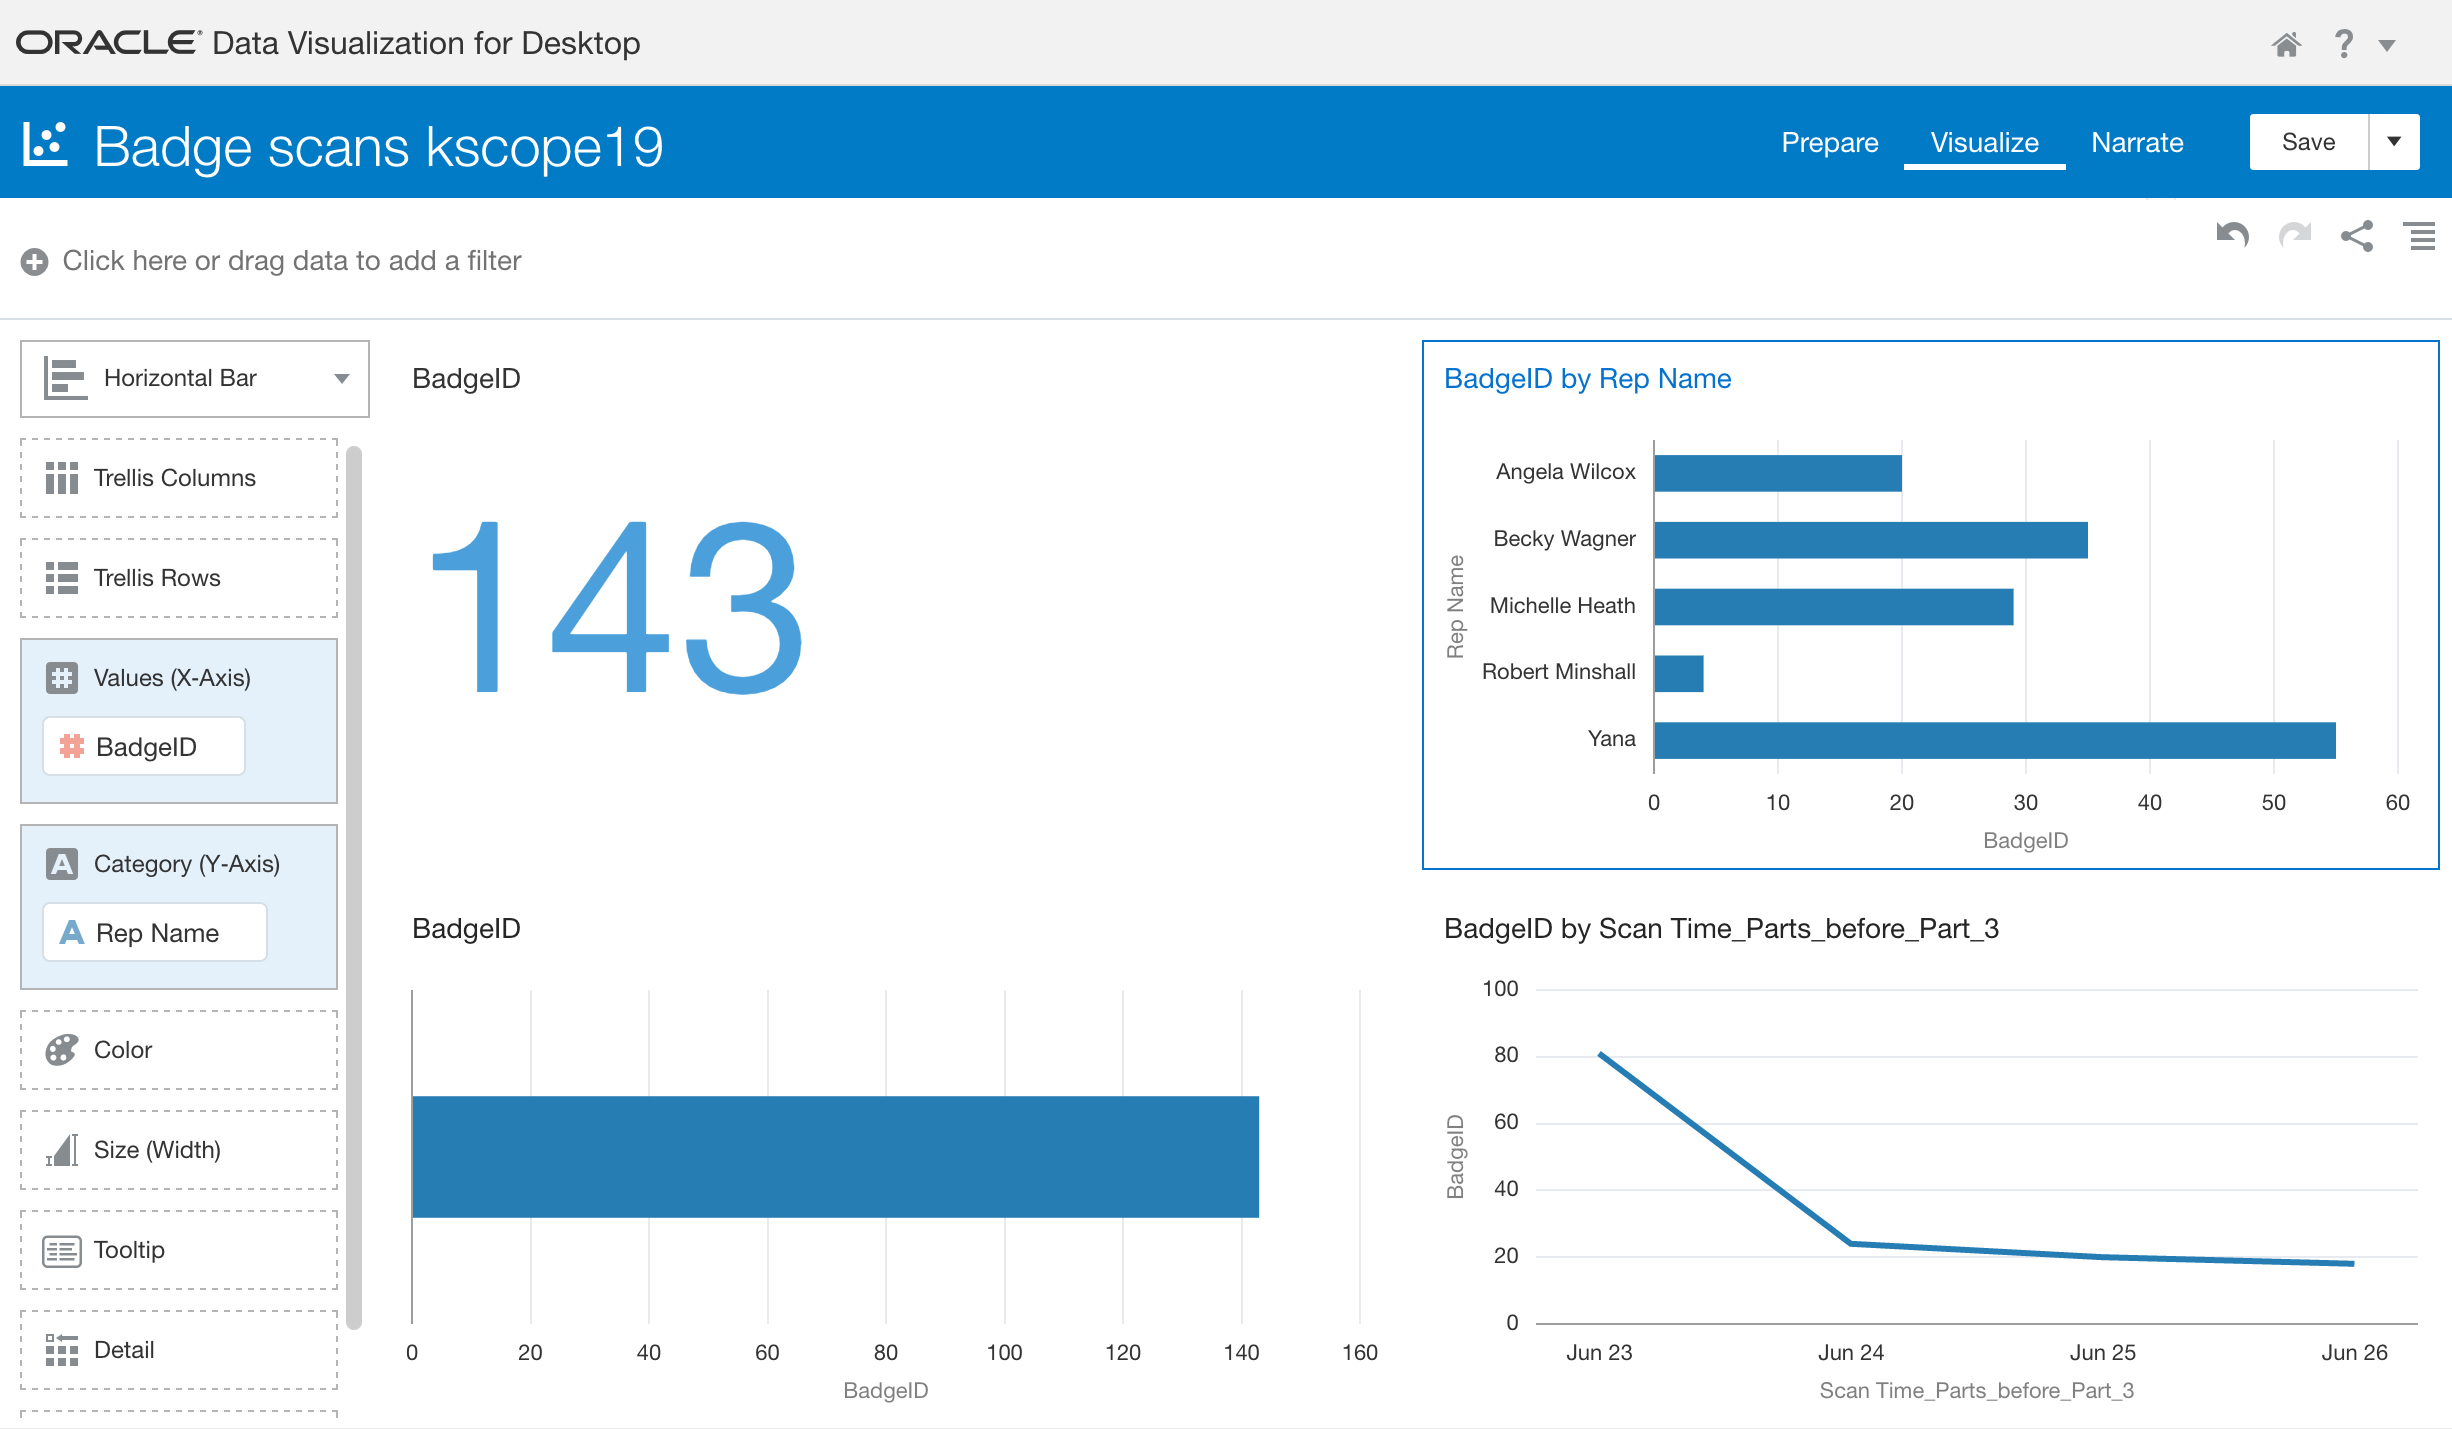
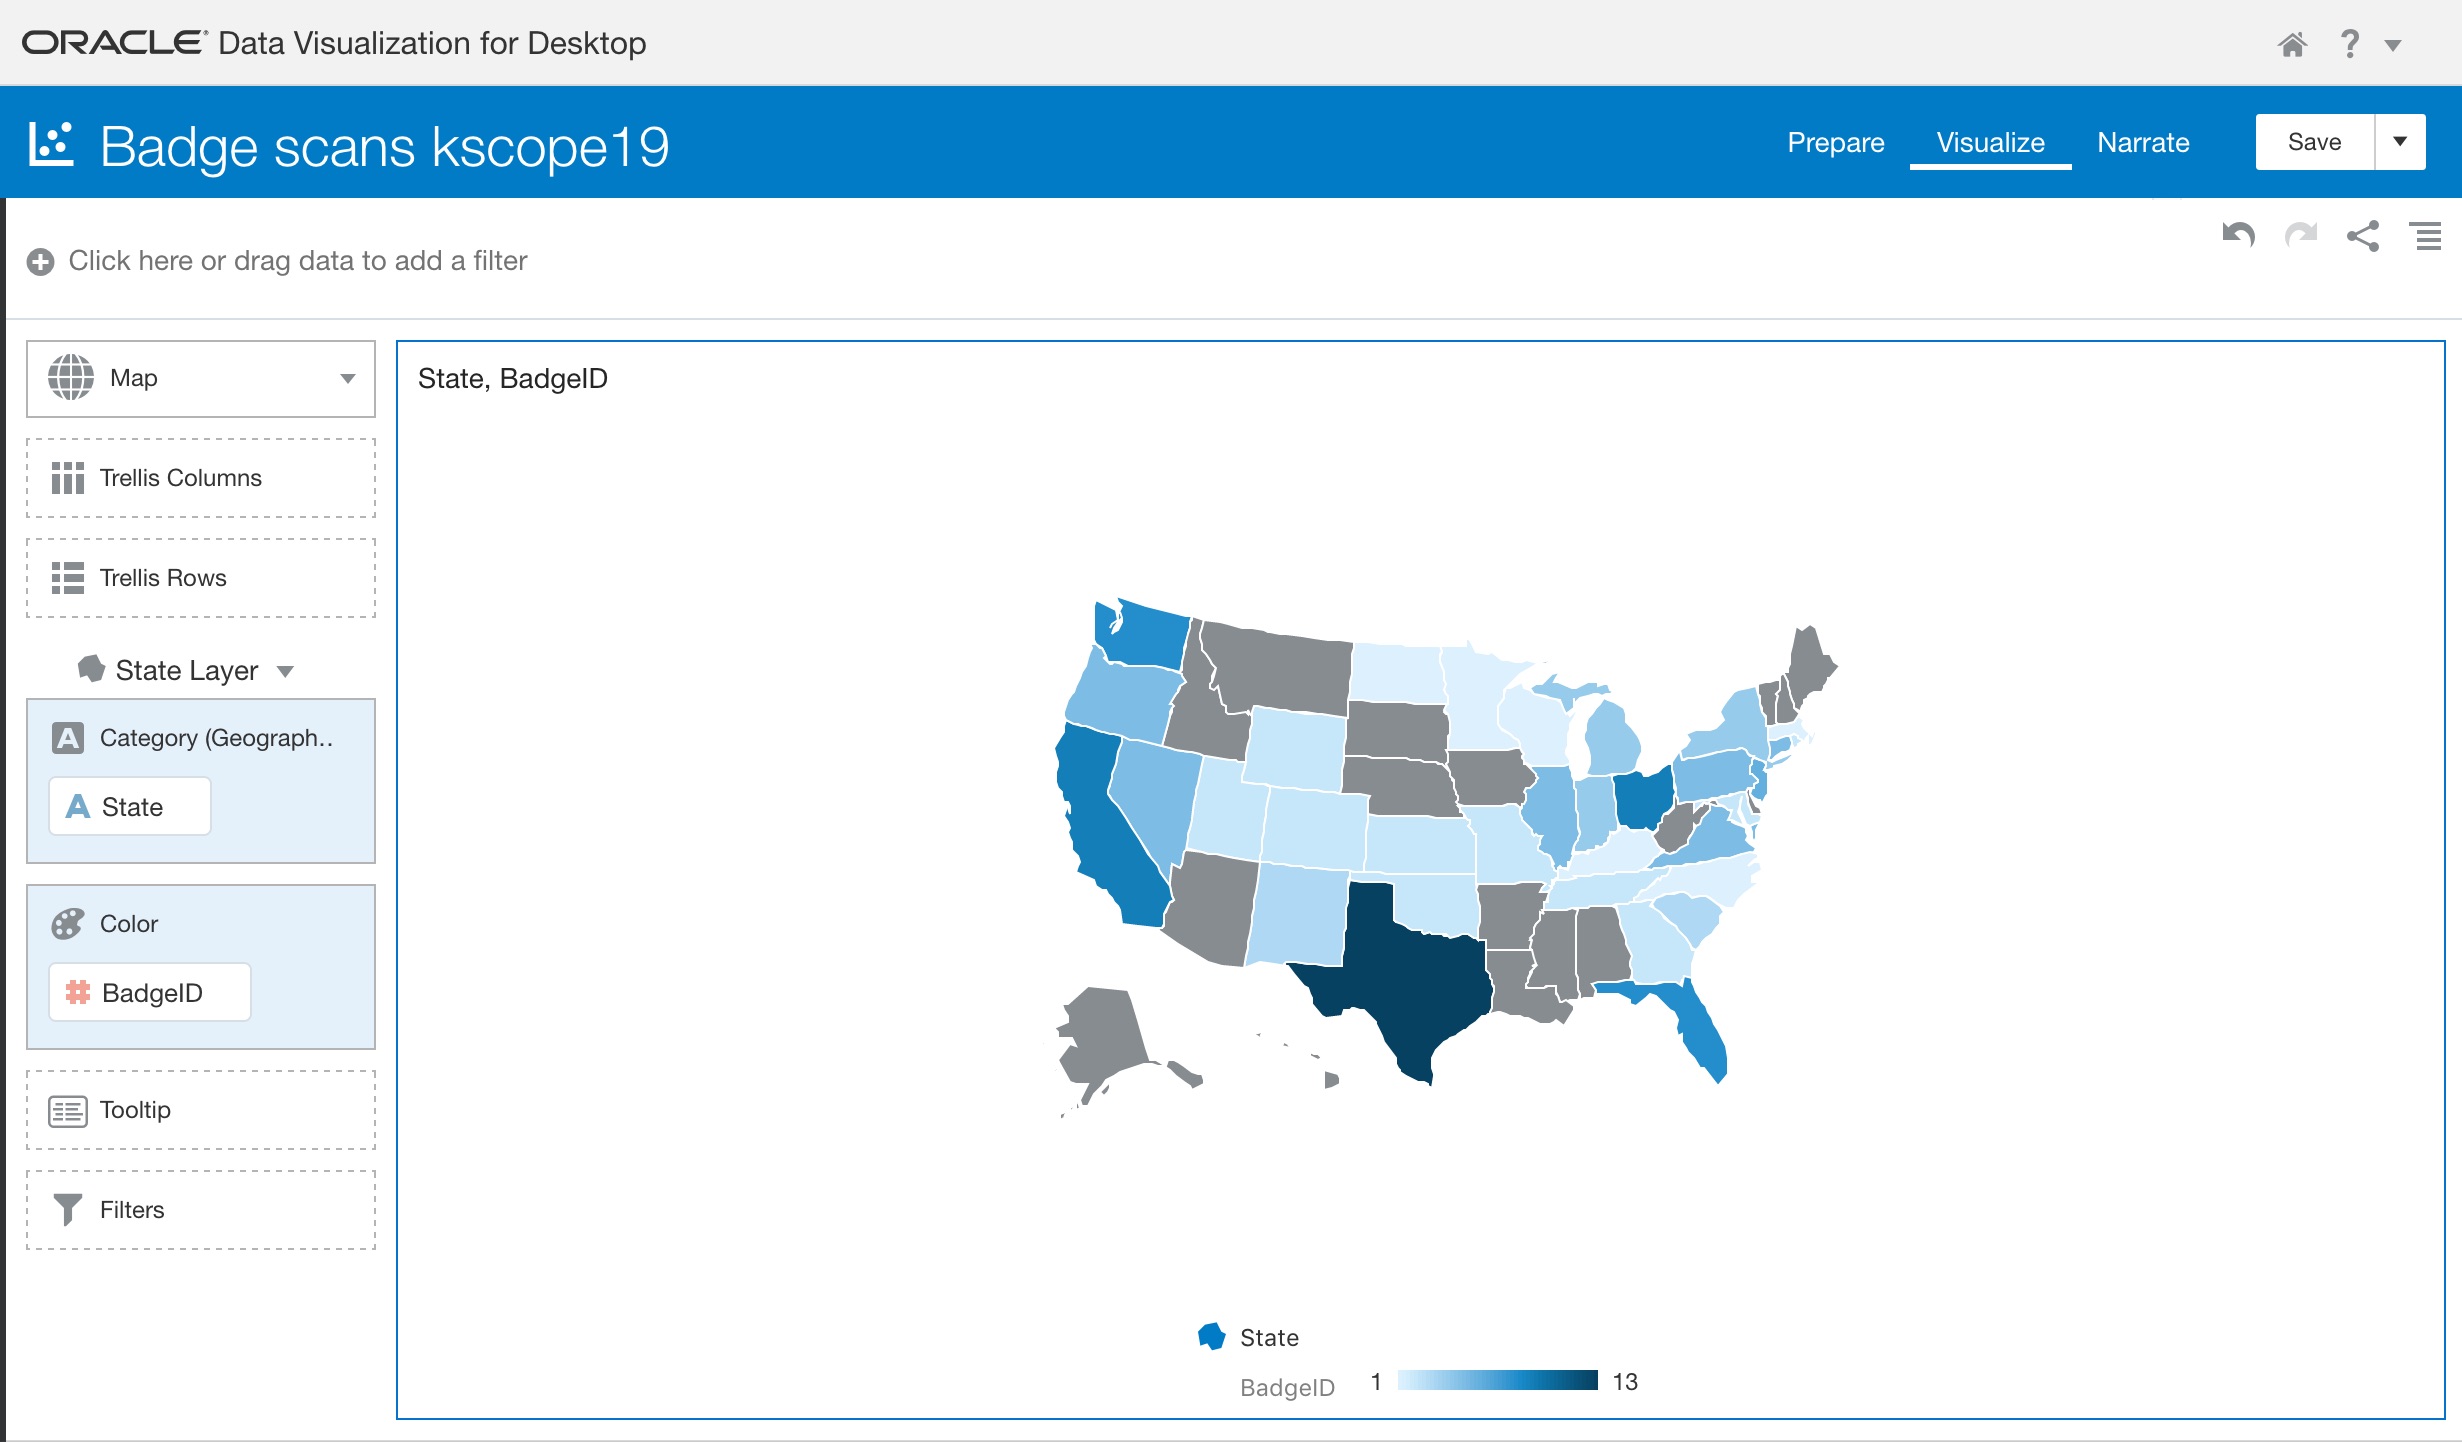
Then I cover what my colleague Corey Nason and I have been working on over the last few weeks. We have pulled in files and have a full audit by person or by subject area for all security permissions. The details can be found on the slides here.
Neviana does #data4good
Neviana has been doing some amazing things this year with #data4good, and FABE (For All a Beautiful Earth). She shows how her visualizations make the most impact by being similar to the devastating image used beside it. These datasets are now available on the public Oracle Analytics Cloud sandbox as well!
Neviana also announced a new project we are gathering a committee for:
With the @OracleAnalytics team members and the #ODTUG Data Visualization Showcase panelists!
— Neviana👩🏻💻🗯 (@NevianaZhgaba) June 27, 2019
The #Data4Good initiative has officially kickstarted! Contact @Bec_Wagner or myself if you’d like to #GetInvolved pic.twitter.com/QBcnbOz4Lh
Gary recaps and shows us elbows
Last but not least, Gary did a great recap and then showed us how to build our own custom visualization plugins, as well as highlighting the library where Oracle and the public can share their own plugins as well. Gary’s built a few plugins, the Butterfly Chart, the Vertical Waterfall, and my favorite “Elbow” Dendrogram
Thursday Deep Dives at #Kscope19! pic.twitter.com/Unnozmr8zn
— ODTUG (@odtug) June 27, 2019